EXECUTIVE SUMMARY
This study explored the possibility of using Landsat-8 OLI Imagery to estimate spruce budworm (Choristoneura fumiferana Clem.; SBW) defoliation levels in Bas-Saint-Laurent-Gaspésie regions of Québec, where an outbreak has been expending since 2014. Seven vegetation indices were tested for their relative influence in predicting SBW defoliation levels. A combination of Green Chlorophyll Index (Chlgreen) and Normalized Difference Moisture Index (NDMI), as the top two predictors determined by Gradient Boosting Machine (GBM) analysis, showed the highest overall accuracy in determining defoliation levels in the following year. During the modeling training and testing processes, the annual aerial sketch maps (ASMs) gained from aerial defoliation surveys conducted by the Québec government were used as the observation values to train and validate the classification model. The results showed the overall accuracy of the model was 35.7% with Kappa = 0.05. This study suggested that the satellite-derived data can be ancillary or alternative information for ASMs, which benefit forest management.
1. GENERAL BACKGROUND
1.1 Introduction
The spruce budworm (Choristoneura fumiferana Clem.; SBW) is one of the most destructive insects in North America’s conifer forests, and has been found throughout the range of its primary host trees, balsam fir (Abies balsamea L. Mill.) and spruce (Picea spp. A. Dietr.), for thousands of years (Balch, 1958). Having a typical one-year life cycle, SBW larvae usually start feeding on new needles and buds in each spring and finish their foliage consumption in middle summer (MacLean, 1984). These SBW larvae can cause serious defoliation among stands and forests when they occur in high population levels (Blais, 1985).
SBW outbreaks typically occur every 35 years, which are historically the most important driver of forest structure development (Baskerville, 1975; Royama, 1984). Outbreaks significantly impact carbon cycles, species composition, and age-class distributions at stand and landscape levels (Gray and MacKinnon, 2006). Currently, another SBW epidemic is taking place in Québec, which began to increase in 2006 and has grown exponentially from 2014 to present (QMRNF, 2018). Quantifying the extent and severity of the SBW defoliation is in need to determine the effects of insect feeding on tree growth and mortality, hazard assessment, and implementing protection programs (MacLean and MacKinnon, 1998).
Generally, there are three approaches to estimate SBW defoliation. First, ocular whole-tree surveys in permanent sample plots or branch sampling with a rating of defoliation on individual shoots are practical at the plot or stand scale (MacLean and Lidstone, 1982; MacLean and MacKinnon, 1998). However, as one can imagine, the labor work is time-consuming, and the accuracy depends on the experience of the observer (MacLean and Lidstone, 1982). Second, at a landscape scale, defoliation surveys are annually conducted by federal and provincial governments, in the format of aerial sketch maps (ASMs) obtained from aerial surveys over large areas (QMRNF, 2018). Implementation requires trained observers located inside of fix-winged aircraft flying at an altitude of 150-300 m, covering the landscape using systematic flight patterns of 2-5 km spacing over SBW infested forests (MacLean and MacKinnon, 1996). Although ASM data collection can be expensive and laborious, the accuracy of aerial survey data was indicated reasonably good for higher levels of SBW defoliation detection while less good for lower defoliation classes (MacLean and MacKinnon, 1996; Taylor and MacLean, 2008). The third approach to do SBW defoliation estimation is based on remotely sensed imagery which has been proved to be a practical way to monitor forest pest disturbances, for example, jack pine budworm (Choristoneura pinus Freeman) outbreak (Radeloff et al., 1999), hemlock looper (Lambdina fiscellaria Guenée) outbreak (Fraser and Latifovic, 2005), and mountain pine beetle (Dendroctonus ponderosae Hopkins) outbreak (Franklin et al., 2003). To estimate SBW defoliation, some efforts have been made and have shown some positive results of the utility of remote sensing techniques on SBW defoliation management (Franklin et al., 2008; Rahimzadeh-Bajgiran et al., 2018). Following the methodology proposed by Rahimzadeh-Bajgiran et al. (2018), this study tested the applicability of such techniques to estimate SBW defoliation levels of the current outbreak in Québec.
1.2 Objectives
This project aimed to test the use of Landsat 8 Operational Land Imager (OLI) data to estimate and classify SBW defoliation levels in Bas-Saint-Laurent-Gaspésie regions of Québec, Canada. Three specific objectives were to 1) generate vegetation indices from Landsat 8 OLI data in 2015 summer (i.e., Jul. and Aug.); 2) train the defoliation classification model with 2015 ASM data as the observations and the top vegetation indices as predictor variables; and 3) predict the defoliation level classification of the same region in 2016 using the trained model and compare the results to the observations according to the ASM in 2016.
2. MATERIALS
2.1 Study Area
The study area was located in the northern part of Bas-Saint-Laurent-Gaspésie regions in Québec; it encompassed approximately 66°22’ to 66°53’ W and 48°55’ to 49°6’ N, amounting to 1664 km^2 (Figure 1). This region had a high forest cover of SBW host species, i.e., balsam fir and spruce (Belanger et al., 1992). The elevation of the study area ranges from 275 to 315 m, with mean annual temperature varies between 0.1 °C and 2.8 °C (Archambault et al., 1998). Forest defoliation because of the SBW outbreak in this area began in about 2013 and rapidly increased to moderate and severe levels in 2015 and 2016 (QMRNF, 2014, 2015, 2016).
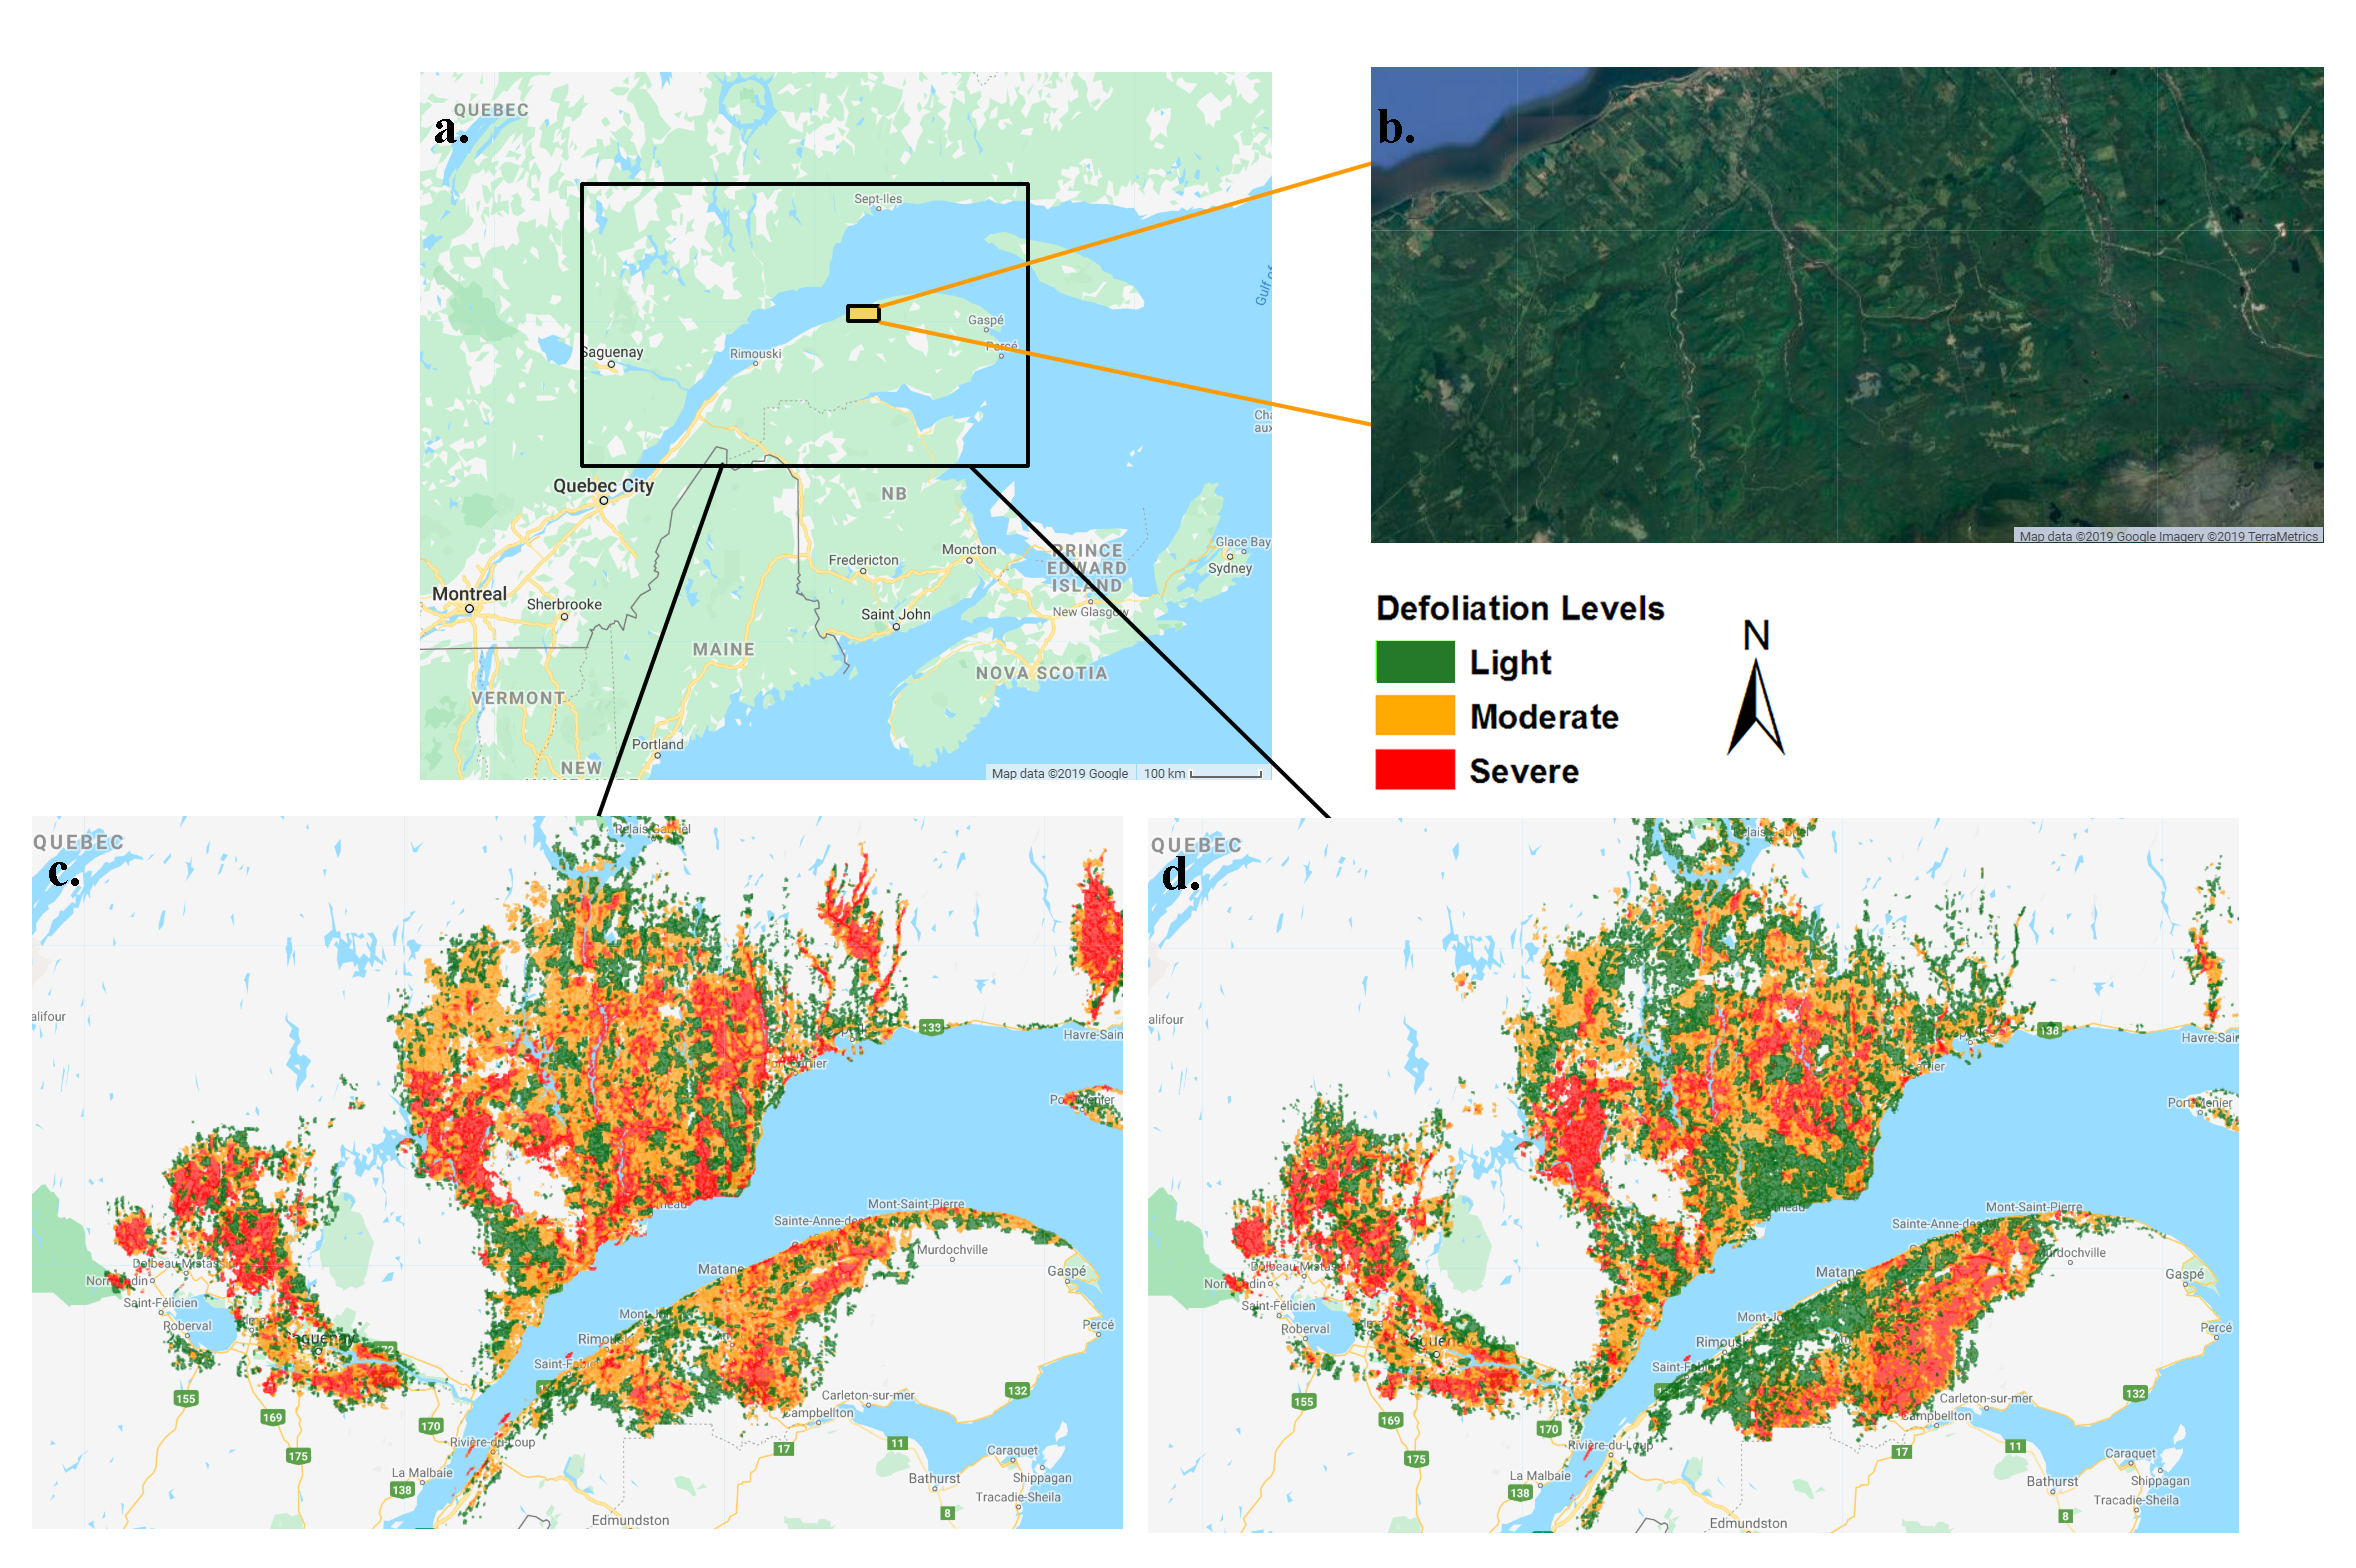
Figure 1. Study area and aerial sketch maps of spruce budworm defoliation (classes: light 0-30%, moderate 31-70%, and severe 71-100%). a. Overview of the study area at the landscape scale. b. True color remote sensing imagery of the study area. c. Distribution of spruce budworm defoliation classes in Québec in 2015. d. Distribution of spruce budworm defoliation classes in Québec in 2016.
2.2 Aerial Survey Data and Satellite Imagery Acquisition
Defoliation surveys over Québec have been annually conducted by the Québec government during late summer, either July or August, this is the time SBW usually finish their feeding, and the defoliation of spruce and fir foliage can be noticeable by being characterized by red-brown coloration (Taylor and MacLean, 2008). The ASMs from aerial surveys in 2015 and 2016 were provided by Ministère des Forêts, de la Faune et des Parcs, Québec, Canada (QMRNF, 2015, 2016). Ministère des Forêts, de la Faune et des Parcs has classified SBW defoliation into three levels, i.e., light (0-30%), moderate (31-70%), and severe (71-100%), and applied the classification scheme on the ASMs. The obtained defoliation ASMs were in the formats of vector polygons.
To conduct this study, the satellite imagery should meet the requirements: 1) spatial resolution <= 30 m; 2) spectral bands include visible, near-infrared (NIR), and shortwave-infrared (SWIR); and 3) revisiting period is 10 to 20 days. Hence, Landsat series of satellite imagery was selected for this project because of their appropriate spatial (30 m) and spectral resolution (described in the next section), as well as their revisit period (16 days). Landsat 1-6 were not active during the study years of 2015 and 2016, and Landsat 7 data suffered from striping problems over the study area. Therefore, Landsat 8 OLI datasets were used in this study. The Landsat 8 OLI atmospherically corrected images of surface reflectance with 30 m spatial resolution are obtained from Google Earth Engine (Gorelick et al., 2017), which was originally offered by the United States Geological Survey for the study year 2015 and the prediction year 2016. To match the timing of the defoliation aerial surveys by the Québec government, remote sensing data during the same period (i.e., Jul. to Aug.) were in need. It should be noticed that during several visit times in 2015 and 2016 summer, Landsat 8 OLI imagery largely suffered from cloud contaminants, which made obtaining cloud-free imagery challenging and limited in choice. Therefore, two sets of cloud-free imagery in 2015 and 2016 summer were adopted: the imagery of Jul.13 2015 was used for training the classification model, and the imagery of Aug.23 2016 was used to test the performance of the model in prediction (Figure 2).
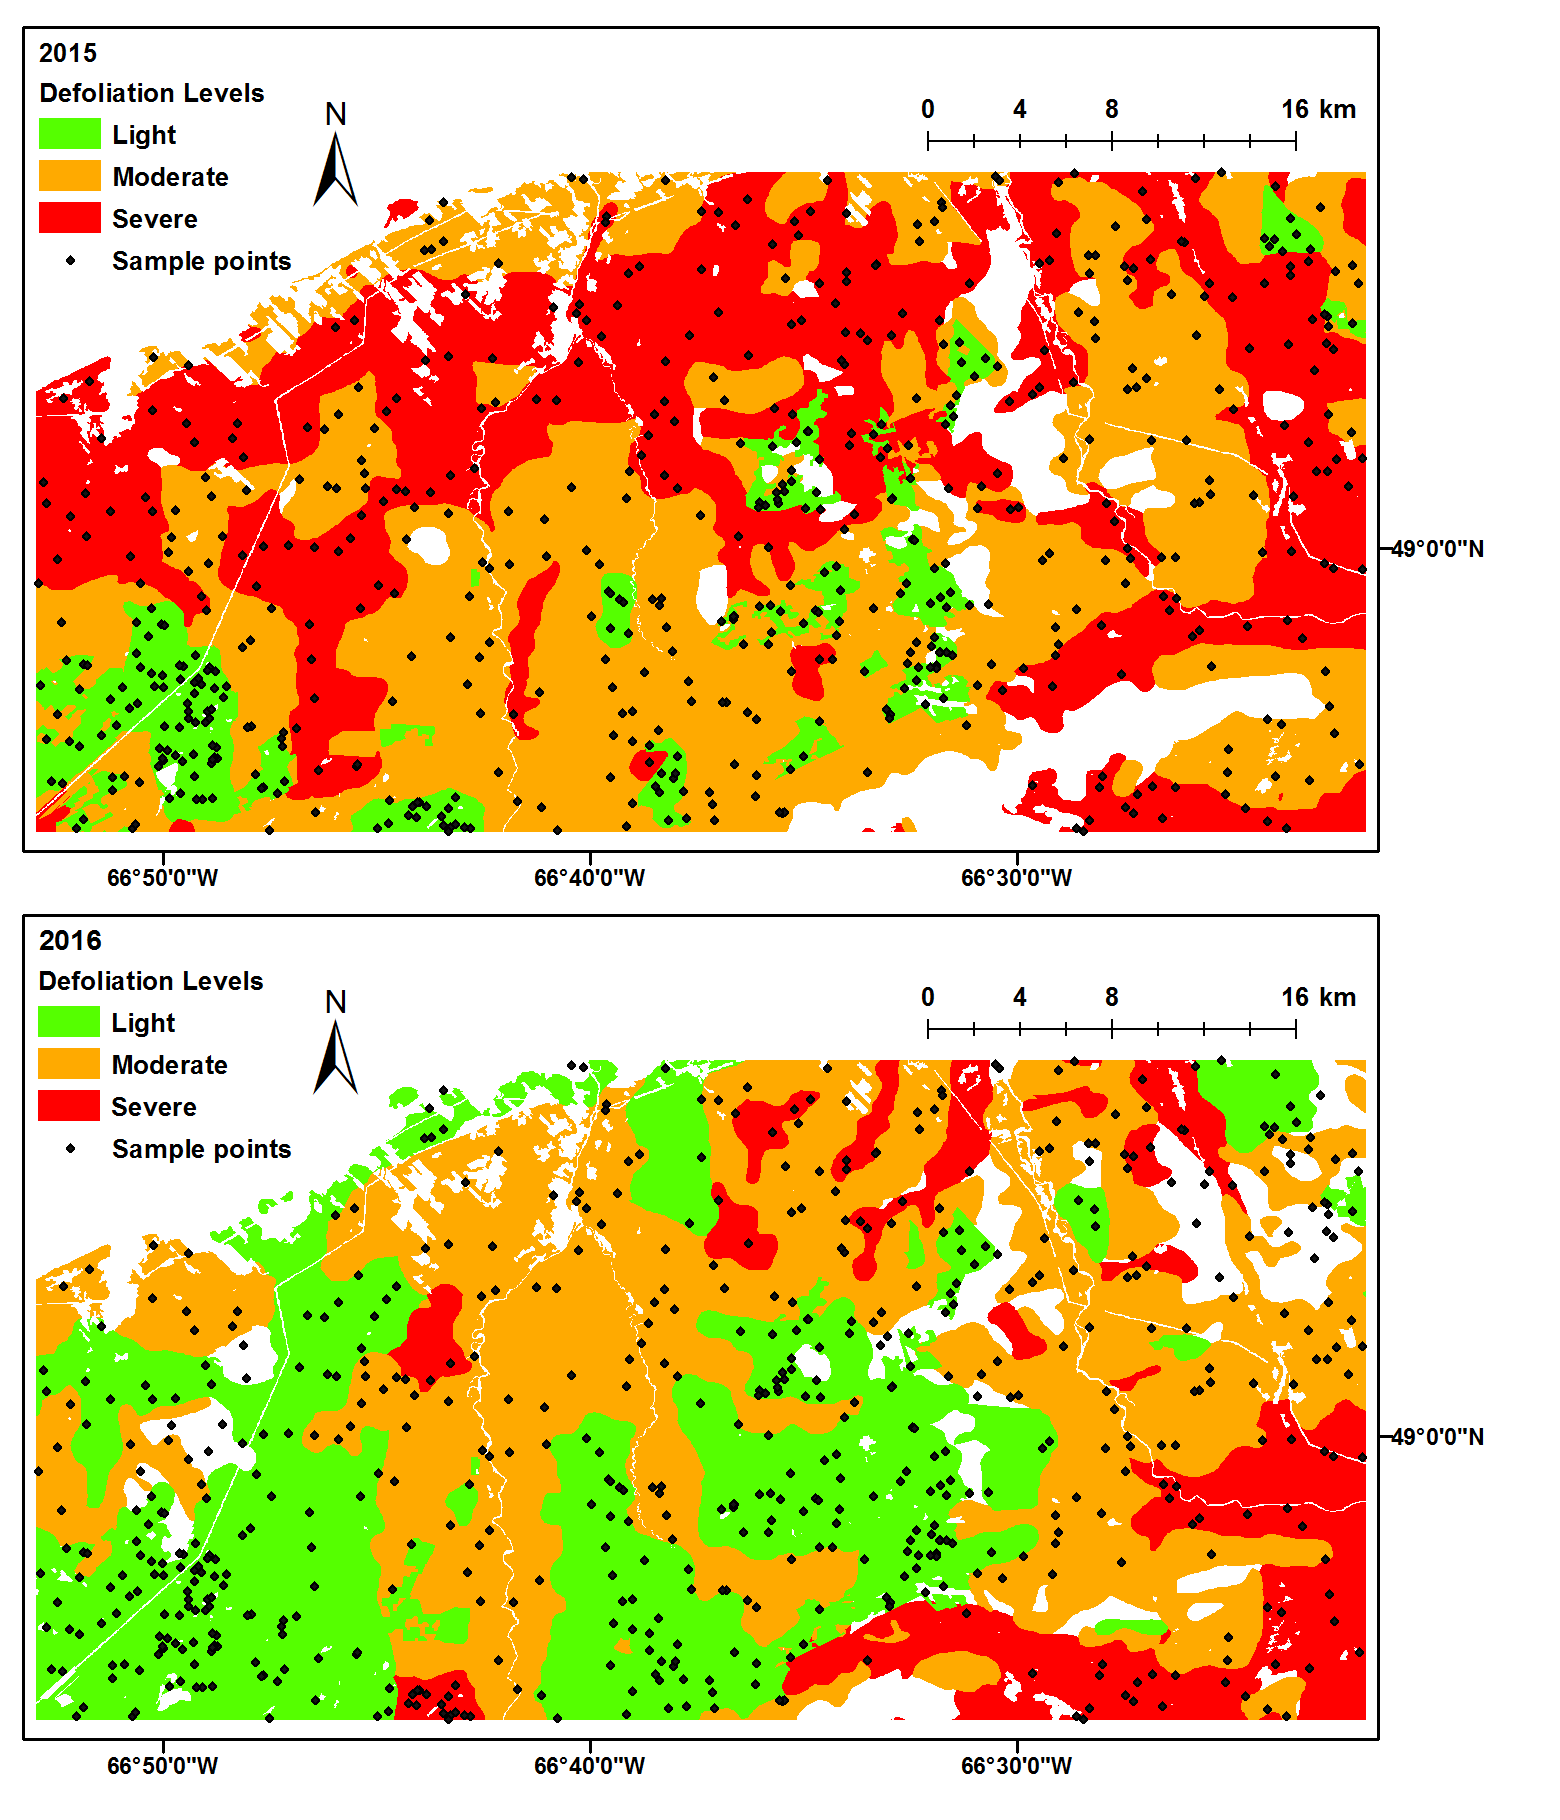
Figure 2. Aerial sketch maps of spruce budworm defoliation (classes: light 0-30%, moderate 31-70%, and severe 71-100%) in the study area in 2015 and 2016, and distribution of sample points which were generated in equal number within each of the three defoliation classes regions according to the aerial sketch map in 2015.
3. METHODS
3.1 Vegetation Indices Generation
Landsat 8 OLI has four optical bands: ultra-blue (0.43-0.45 um), blue (0.45-0.51 um), green (0.53-0.59 um), and red (0.64-0.67 um), one NIR band (0.85-0.88 um), two SWIR bands (1.57-1.65 um and 2.11-2.29 um), and two thermal bands (10.60-11.19 um and 11.51-12.51 um). By using visible, NIR, and SWIR bands, seven vegetation indices were generated from the Landsat 8 OLI atmospherically corrected images of surface reflectance, including Normalized Difference Vegetation Index (NDVI), Enhanced Vegetation Index (EVI), Soil Adjusted Vegetation Index (SAVI), Normalized Difference Moisture Index (NDMI), Normalized Burn Ratio 1 (NBR1), Normalized Burn Ratio 2 (NBR2), and Green Chlorophyll Index (Chlgreen). The name, abbreviation, and detailed calculations for these seven vegetation indices were introduced in Table 1. The vegetation indices were calculated for both Jul.13 2015 and Aug.23 2016 imagery. An example of calculated NDVI in both years was shown in Figure 3.
Table 1. Landsat remotely-sensed vegetation indices calculated in this study for spruce budworm defoliation estimation.
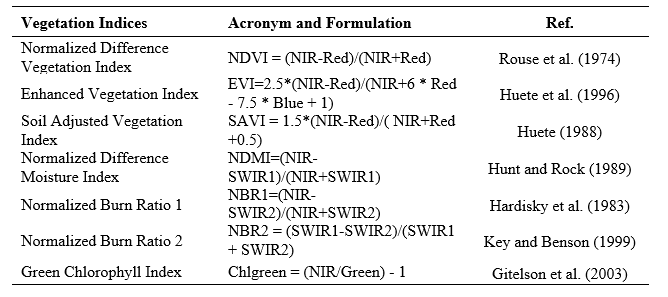
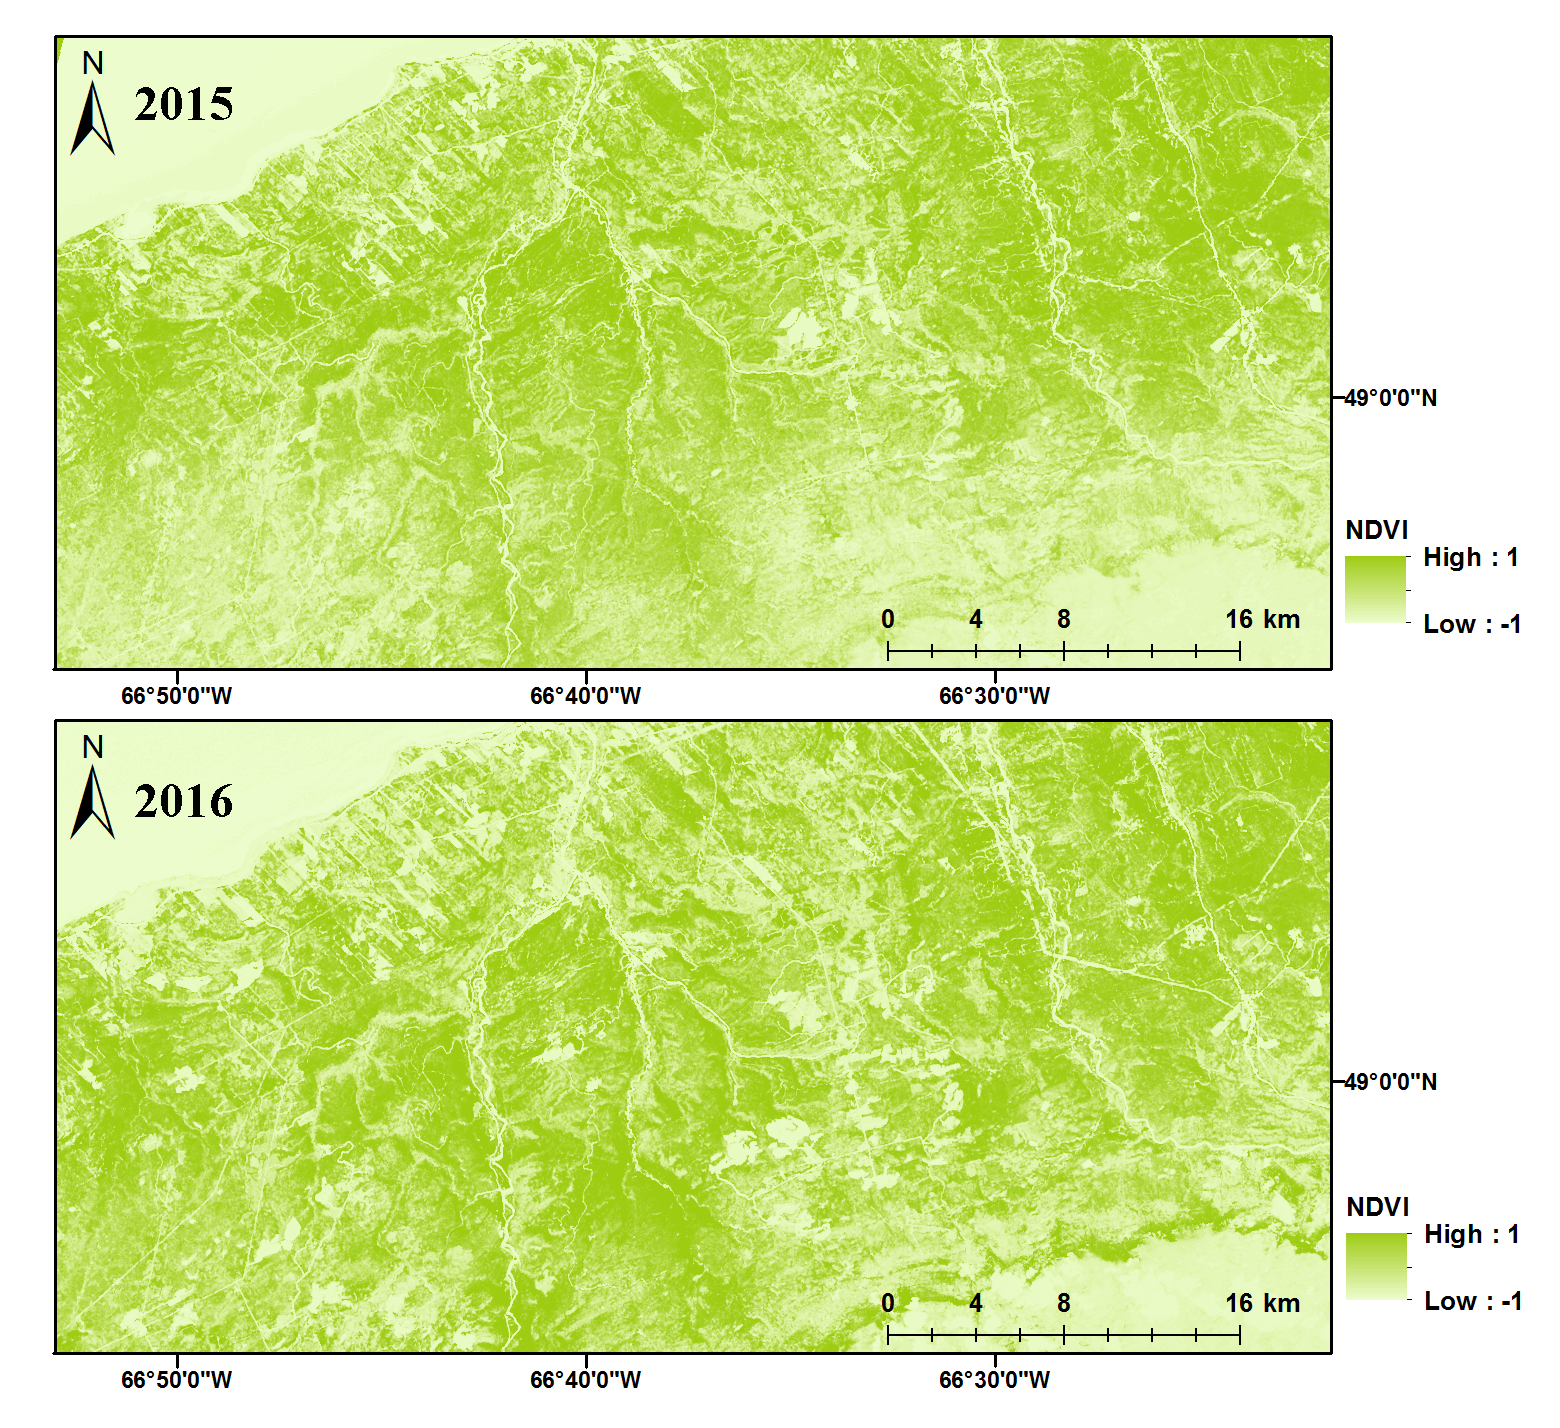
Figure 3. Normalized difference vegetation index generated from Landsat 8 OLI imagery within the study area in 2016 and 2016.
3.2 Sample Points Distribution
Ministère des Forêts, de la Faune et des Parcs has classified SBW defoliation into three levels, i.e., light (0-30%), moderate (31-70%), and severe (71-100%), and applied the classification scheme on the ASMs. This study followed the same classification scheme. Within the study area, 600 sample points in total were randomly selected, with 200 sample points in each of the three defoliation levels regions according to the ASM in 2015 (Figure 2). Because the ASM polygons only contained forest land cover, sample points generated within the ASM polygon boundaries were assumed to be located only in forests. The values for seven vegetation indices generated were extracted for 600 sample points by overlaying these sample points on the vegetation index layers, for both year 2015 and 2016.
3.3 Gradient Boosting Machine Analysis
Gradient Boosting Machine (GBM) analysis (Ridgeway, 2007) was used to determine the relative influence of seven vegetation indices in forecasting SBW defoliation levels. As a machine learning technique, gradient boosting determines the performance of decision trees using gradients in the loss function in a sequential fashion (Friedman, 2001). As the output of GBM analysis, seven vegetation indices were ranked from the highest to lowest according to their relative influences. The vegetation indices combinations were then selected according to the GBM results, in a forward-model-selection fashion, and used to train the classification models. In total, six classification models were trained using the combinations of the top two ranked vegetation indices, top three ranked vegetation indices, top four ranked vegetation indices, and the rest was done in the same manner. The trained model was then applied to the 2016 vegetation indices dataset to forecast the defoliation level distribution in 2016. Finally, the observations (i.e., values gained from ASM in 2016) and the forecasts (i.e., values predicted by the trained classification model) of the model with the highest overall accuracy were compared by the confusion matrix.
Remote sensing data collection, vegetation indices calculation, and sample points generation were conducted by Google Earth Engine (Gorelick et al., 2017). R 3.4.3 (R Core Team, 2018) was used for GBM model training, defoliation level prediction, and confusion matrix generation.
4. RESULTS
4.1 Relative Influence of Vegetation Indices
GBM tests showed that Chlgreen, NDMI, and NDVI were the most important vegetation indices to predict SBW defoliation levels (Figure 4). Specifically, Chlgreen was the most important predictor (relative influence = 31%), followed by NDMI (relative influence = 24%), and NDVI (relative influence = 18%; Figure 4). EVI, one of the three predictors which provided the highest accuracy for SBW defoliation classification according to the results of Rahimzadeh-Bajgiran et al. (2018), was the fourth important predictor in this study (relative influence = 9%; Figure 4). SAVI ranked as the bottom predictor only showed 1.3% relative influence (Figure 4).
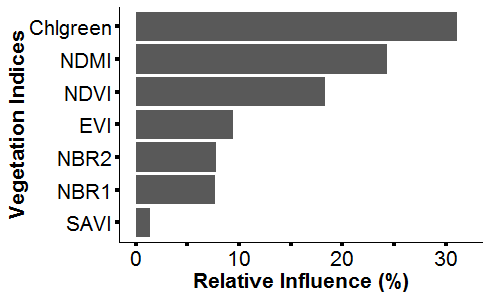
Figure 4. Relative influence (%) of seven vegetation indices to predict SBW defoliation levels based on Gradient Boosting Machine analysis. Vegetation indices abbreviations are described in Table 1.
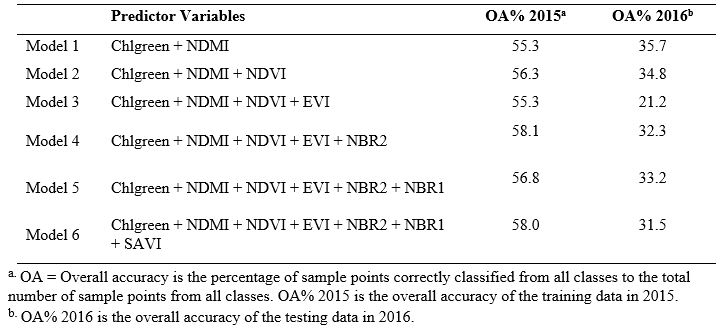
The overall accuracy (i.e., the percentage of sample points correctly classified from all classes to the total number of sample points from all classes; OA) of the models validated by the training data in 2015 ranged from 55.3% to 58.1% among all the candidate models, with Model 4 including Chlgreen, NDMI, NDVI, EVI, and NBR2 as the predictor variables showing the highest OA (58.1%; Table 2). The OA of the models applying to the testing data in 2016 ranged from 21.2% to 35.7% (Table 2). Among all the models, Model 1 with Chlgreen and NDMI as the predictor variables showed the highest OA with 35.7% of the testing data in 2016, while relatively lower OA (55.3%) of the training data in 2015 compared to the other candidate models (Table 2). OA of the training data was consistently higher than OA of the testing data in 2016 among all candidate models, and models with more predictor variables generally showed higher OA of the training data in 2015 (Table 2).
Table 2. Candidate classification models trained by 2015 data for predicting spruce budworm defoliation levels in 2016. Overall accuracy for both training data (2015) and testing data (2016) were given. Vegetation indices abbreviations are described in Table 1.
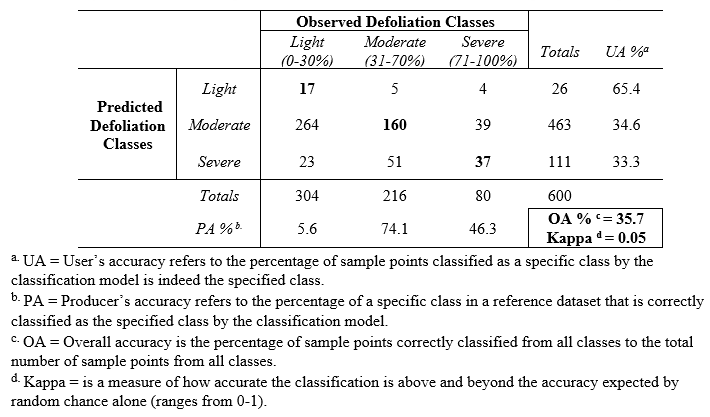
The confusion matrix of Model 1 applying on the 2016 testing data suggested that respectively 17, 160, and 37 out of 600 sample points were predicted to be classified into the same defoliation levels of light, moderate, and severe, respectively, as the observations from the ASM in 2016 (Table 3). The results showed a relatively higher user’s accuracy (i.e., the percentage of sample points classified as a specific class by the classification model is indeed the specified class; UA) for the light defoliation level (65.4%), compared to the moderate (34.6%) and severe level (33.3%; Table 3). On the other hand, the producer’s accuracy (i.e., the percentage of a specific class in a reference dataset that is correctly classified as the specified class by the classification model; PA) was higher in the moderate defoliation level (74.1%), compared to the light (5.6%) and severe level (46.3%; Table 3). The overall accuracy of the classification model was 35.7%, with Kappa = 0.05 (Table 3).
Table 3. Confusion matrix comparing 2016 classification results of three defoliation classes (light 0-30%, moderate 31-70%, and severe 71-100%) from classification model forecasts by Model 1 with aerial surveyed defoliation categorized into three identical classes enabling direct comparison.
5. DISCUSSION
Among all the candidate models, those with more predictor variables generally showing higher OA of the training data in 2015 was understandable because more classification criteria help optimize the classification procedure. However, Model 1 with relatively lower OA of the training data showed the highest OA when being applied to the testing data in 2016, and Model 6 with all predictor variables which showed the highest OA of the training data had relatively lower OA when being applied to the testing data. The differences of OA when being applied to training data and testing data that candidate models have shown were due to complicated reasons. One of the reasons can be that the time-lag between two sets of Landsat 8 OLI imagery obtained in two years: Jul.13 in 2015 versus Aug. 23 in 2016. These two dates were selected originally because they were the only dates Landsat 8 visited the study area during middle-late summer and the image was almost free of cloud contamination. In theory, SBW should almost finish their feeding stage in July and start to mate, disperse, and lay eggs during this time (Baskerville, 1975; Royama, 1984). Nonetheless, it very possible that the exact dates of the major of SBW finished their consumption of foliage can vary among years. Thus, the difference of 40 days (Jul.13 in 2015 versus Aug. 23 in 2016) may lead to less accuracy of forecasts of 2016 defoliation levels. Other potential causes included sample sizes, sampling distribution design, accuracy of ASMs, etc. To improve the classification ability of the model, further study may consider an optimized sampling design, adopting more accurate, field-collected defoliation data as their observations to train models, and use hyperspectral imagery to develop predictor variables.
Model 1, as the model with highest OA of testing data in 2016, included Chlgreen and NDMI as predictors, which partially agreed with the conclusion drawn by Rahimzadeh-Bajgiran et al. (2018) that a combination of Chlgreen, NDMI, and EVI provided the highest accuracy for SBW defoliation classification. Specifically, the model had relatively higher UA in light defoliation detection and higher PA in moderate and severe defoliation detection.
This study showed that satellite-derived data on forest defoliation can potentially have several advantages over ASMs. It is less costly in terms of labor and time, and practical to monitor a specific area consistently over the years. The satellite-derived data can be ancillary or alternative information for ASMs, especially over large interested areas.
This study used two Landsat 8 OLI datasets over the study area (about 1664 km2) in the northern part of Bas-Saint-Laurent-Gaspésie regions in Québec, Canada, to generate vegetation indices and then train classification models, aiming to effectively determine SBW outbreak extent and severity in this region without laborious and time-consuming survey. The results of this study suggested that the best model of predicting defoliation classes included Chlgreen and NDMI as predictor variables and was able to correctly classify defoliation in 35.7% of the cases, which partially agreed with the previous research conclusions (i.e., Rahimzadeh-Bajgiran et al., 2018). The study results can be potentially improved by better sampling design or usage of hyperspectral imagery. Nonetheless, the study has shown the potential of satellite-derived data to be as ancillary or alternative information for ASMs particularly at a large spatial scale. Understanding the forest pest outbreak extent and severity benefits outbreak control strategies and evaluating forest effects of the outbreak in terms of tree growth loss, mortality, economic loss, etc.
REFERENCES
Archambault, L., Morissette, J., Bernier-Cardou, M., 1998. Forest succession over a 20-year period following clearcutting in balsam fir-yellow birch ecosystems of eastern Québec, Canada. For. Ecol. Manage. 102.
Balch, R.E., 1958. The spruce budworm in New Brunswick. Science Service, Forest Biology Division, Dept. of Agriculture, Ottawa, ON, Canada.
Belanger, L., Bergeron, Y., Camire, C., 1992. Ecological land survey in Québec. For. Chron. 68, 42-52.
Blais, J.R., 1985. Impact of the spruce budworm on balsam fir and white spruce in the Laurentian reserve, Québec: an interim report, Print book ed. Canadian Forestry Service, Sainte-Foy, Québec.
Franklin, S., Fan, H., Guo, X., 2008. Relationship between Landsat TM and SPOT vegetation indices and cumulative spruce budworm defoliation. Int. J. Remote Sens. 29, 1215–1220.
Franklin, S., Wulder, M., Skakun, R., Carroll, A., 2003. Mountain pine beetle red-attack forest damage classification using stratified Landsat TM data in British Columbia, Canada. Photogramm. Eng. Remote Sens. 69, 283–288.
Fraser, R., Latifovic, R., 2005. Mapping insect-induced tree defoliation and mortality using coarse spatial resolution satellite imagery. Int. J. Remote Sens. 26, 193–200.
Friedman, J.H., 2001. Greedy function approximation: a gradient boosting machine. Ann. Stat. 29, 1189-1232.
Gitelson, A.A., Vina, A., Arkebauer, T.J., Rundquist, D.C., Keydan, G., 2003. Leavitt, B. Remote estimation of leaf area index and green leaf biomass in maize canopies. Geophys. Res. Lett. 30, 1248.
Gorelick, N., Hancher, M., Dixon, M., Ilyushchenko, S., Thau, D., Moore, R., 2017. Google Earth Engine: planetary-scale geospatial analysis for everyone. Remote Sens. Environ. 202, 18-27.
Gray, D.R., MacKinnon, W.E., 2006. Outbreak patterns of the spruce budworm and their impacts in Canada. For. Chron. 82, 550-561.
Hardisky, M., Klemas, V., Smart, M., 1983. The influence of soil salinity, growth form, and leaf moisture on the spectral radiance of Spartina alterniflora canopies. Photogramm. Eng. Remote Sens. 49, 77-83.
Huete, A., Justice, C., Leeuwen, W., 1996. MODIS vegetation index (MOD13), EOS MODIS algorithm; theoretical basis document. NASA Goddard Space Flight Center, Greenbelt, MD, USA.
Huete, A.R., 1988. A soil-adjusted vegetation index (SAVI). Remote Sens. Environ. 25, 295-309.
Hunt, E.R., Rock, B.N., 1989. Detection of changes in leaf water content using near-and middle-infrared reflectances. Remote Sens. Environ. 30, 43-54.
Key, C., Benson, N., 1999. Measuring and remote sensing of burn severity., Proceedings of the Joint Fire Science Conference and Workshop, Boise, ID, USA, p. 284.
MacLean, D.A., 1984. Effects of spruce budworm outbreaks on the productivity and stability of balsam fir forests. For. Chron. 60, 273-279.
MacLean, D.A., Lidstone, R.G., 1982. Defoliation by spruce budworm: estimation by ocular and shoot-count methods and variability among branches, trees, and stands. Can. J. For. Res. 12, 582-594.
MacLean, D.A., MacKinnon, W.E., 1996. Accuracy of aerial sketch-mapping estimates of spruce budworm defoliation in New Brunswick. Can. J. For. Res. 26, 2099–2108.
MacLean, D.A., MacKinnon, W.E., 1998. Sample sizes required to estimate defoliation of spruce budworm. North. J. Appl. For. 15, 135-140.
QMRNF, 2014. Aires Infestées par la Tordeuse des Bourgeons de l’épinette au Québec en 2014. Québec Ministère des Ressources Naturelles et de la Faune.
QMRNF, 2015. Aires Infestées par la Tordeuse des Bourgeons de l’épinette au Québec en 2015. Québec Ministère des Ressources Naturelles et de la Faune.
QMRNF, 2016. Aires Infestées par la Tordeuse des Bourgeons de l’épinette au Québec en 2016. Québec Ministère des Ressources Naturelles et de la Faune.
QMRNF, 2018. Aires Infestées par la Tordeuse des Bourgeons de l’épinette au Québec en 2018. Québec Ministère des Ressources Naturelles et de la Faune.
R Core Team, R.D.C., 2018. R: A Language and Environment for Statistical Computing, R Foundation for Statistical Computing, Vienna, Austria.
Radeloff, V.C., Mladenoff, D.J., Boyce, M.S., 1999. Detecting jack pine budworm defoliation using spectral mixture analysis: separating effects from determinants. Remote Sens. Environ. 69, 156-169.
Rahimzadeh-Bajgiran, P., Weiskittel, A.R., Kneeshaw, D., MacLean, D.A., 2018. Detection of annual spruce budworm defoliation and severity classification using Landsat imagery. Forests 9, 357.
Ridgeway, G., 2007. Generalized boosted models: a guide to the GBM package. R Package Vignette.
Rouse, J.W., Haas, R., Schell, J., Deering, D., 1974. Monitoring vegetation systems in the great plains with ERTS. NASA, Washington, DC, USA.
Taylor, S.L., MacLean, D.A., 2008. Validation of spruce budworm outbreak history developed from aerial sketch mapping of defoliation in New Brunswick. North. J. Appl. For. 25, 139–145.