ABSTRACT
Every second a massive amount of remote sensing data are generated by various sensors all around the world. Remote sensing data are experiencing an unprecedented growth both in volume and speed. Therefore, a series of challenges are triggered by the arrival of the remote sensing big data era. Fortunately, we are now witnessing the emergence of new technologies and approaches to deal with the big data issues, such as cloud computing, MapReduce, NoSQL database, etc. Based on these techniques, remote sensing big data are widely applied in social science and natural science, including analyzing land cover changes, monitoring vegetation, tracking global climate changes, and so on. The focus of this paper is to summarize the meaning of big data in the remote sensing application context, and to review the challenges as well as the opportunities it brings to us. A case study is also provided to understand what NASA is doing with big data challenges.
1. INTRODUCTION
Since human beings entered the information age, data carriers and data repositories have doubled every several years [1]. In this century, the rapid development of the Internet as well as computer technologies has prompted the emergence of the big data era in many aspects of life (Figure 1). From this perspective, it is undeniable that now we are living in a digital world, in which the massive remotely sensed data are important parts helping people better understand, monitor, and interact with our living planet. As a significant resource, these data gathered from various sensors on airborne vehicles and satellites are of great value in many fields. Remote sensing big data have been applied to deal with a lot of real-world problems, like vegetation monitoring, urban planning, land cover changes analyzing, crop growth forecasting, etc. Given the growing number of airborne and space-borne sensors, and the increasingly high spatial and spectral resolutions, the age of remote sensing big data has already arrived.
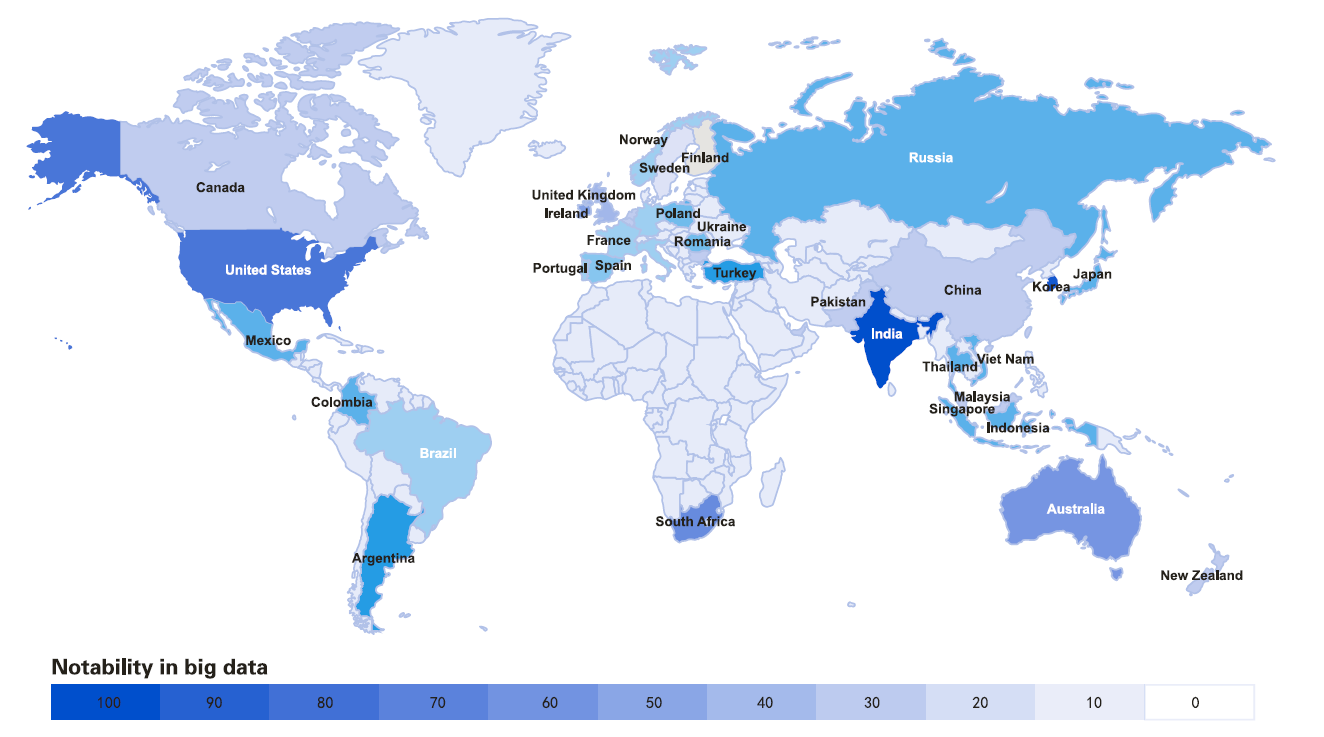
Figure 1. Spotlight on big data in different countries (based on Google Trends; acquired in August 2013; derived from [5]).
Nevertheless, how can we prepare ourselves for the coming of the big data era becomes a big issue nowadays, because the traditional technologies and approaches with which we manage the “moderate” data have become out-of-date. In the context of remote sensing, the digitized world, as well as mobile sensors, are main generators of big data, which are tremendously complicated. As with the big data applications in social and economic fields, remote sensing big data are also of little value until they are understood, processed and analyzed. Therefore, we need the improved technologies and methods to harness the huge volume of remote sensing data and to make the most effective use of them.
In recent years, researchers have been making every effort to develop the latest techniques to exploit and analyze big data in remote sensing applications. The cloud platform, real-time analysis, MapReduce/ Hadoop technology and other modern machine learning methods and classifiers are particularly of interest. In specific cases, a scalable web service for near-time mapping with cloud computing was applied to high-resolution remote sensing images [2]; MapReduce acted as a technology foundation in developing a cloud-enabled Climate Analytics-as-a-Service to deal with climate change issues [3]; and multi-layer architecture with cloud computing was used in Eolic Park big data management [1].
This paper discusses the main properties of remote sensing big data: huge volume, high dimension, and high complexity. The properties of remote sensing big data are in accordance with “4V” which people usually define as general big data, while remote sensing big data also have some specific characteristics because of massive metadata, different resolutions, and distributed data centers. Besides, this paper also elaborates the main challenges posed by remote sensing big data. The challenges lie in each stage of remote sensing analysis, including data owning, data storage, data delivery, data computing, data representation, data fusion, visualization, as well as collaboration between different data centers. In addition, state-of-the-art technologies are introduced by a case study of NASA. In the case study, specific programs, techniques, and initiatives led by NASA are presented in detail.
The remainder of the paper is organized as follows. The second section discusses the understanding of big data in remote sensing. The third section illustrates challenges in different stages of remote sensing big data analysis. Then, the opportunities brought by big remote sensing data are showed in the fourth section. The fifth section presents the state-of-the-art techniques used to harness big data issues in remote sensing. A case study of NASA is also discussed in this section. Finally, the sixth section draws some general conclusions.
2. UNDERSTANDING REMOTE SENSING BIG DATA
People define big data as that which is too big to be reasonably handled by traditional technologies, and describe its characteristics as “4V”, i.e., volume, variety, veracity, and velocity [4]. Inspired by the previous work [5], this paper summarizes the characteristics of big data in remote sensing context as “3H”, i.e., huge volume, high dimension, and high complexity.
Huge volume. The advances in remote sensing led the proliferation of remote sensing data. Currently, over 200 on-orbit satellite sensors are generating remote sensing data, monitoring the global surface, atmosphere, climate changes, vegetation, oceans, etc. The data collected by the space-borne of NASA missions on the GB level every second [6]. It is worth mentioning that since the first Earth observation satellite launched by NASA 50 years ago, there have been more than 510 Earth observation satellite launched all around the world, constituting a the comprehensive Earth observation system (Figure 2) [7]. Related statistics and analyses show that NASA’s Earth Observation System Data and the Information System (EOSDIS) housed 7.5 PB (1PB=1024TB) of data with around 7,000 data sets in 2013, and the European Space Agency held 1.5 PB Earth observation data by 2014 [8], [9]. Data produced by various sensors on Earth observation satellites is increasing at a rate of 4 TB (1TB=1024GB) per day [10].
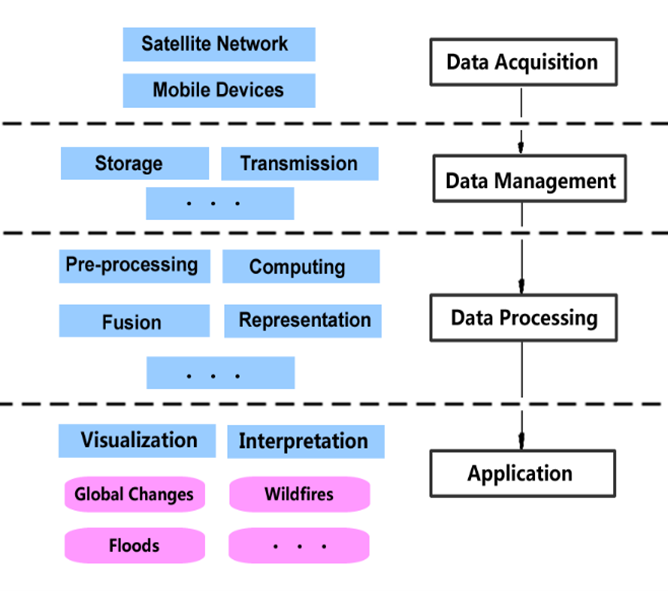
Figure 2. Analysis of the entire remote sensing data processing flow.
High dimension. In terms of high dimension, remote sensing big data is characterized as multiresolution, including a wide variety of different spatial, temporal, as well as spectral resolution, resulting from a lot of satellites and their sensors. Table1 summarizes the spatial, temporal, and spectral resolution of different remote sensing systems. On the other hand, some of the remote sensing applications, like climate change, need a combination of regional and global data. As a result, these applications trigger the pixel’s multi-dimensionality [10]. The correlation of these data is of high dimension, given different sensors, spatio-temporal resolution as well as physical importance [11].
High complexity. The high complexity of remote sensing big data comes from three aspects: metadata, format diversity, and data velocity. First, metadata describes the composition of data and the approach by which they were acquired, whose fast growth is always accompanied by that of remote sensing data [12]. For example, the number of metadata records in EOSDIS exceeds 129 million and grows at the rate of 66,000 every day [9]. Besides, the structures of organized metadata are also complex. The geo-metadata usually consist of image parameters, map parameters, projection parameters, and satellite or sensor parameters, which vary with different swath widths, basic sizes, geographical locations, map usages, projection methods, orbital heights, etc. [10]. Second, the complexity of remote sensing big data also lies in the various data formats including HDF, GeoTIFF, netCDF and so on. Each of these data formats has different physical structure, operation interface and library [13]. What is more important, a lot of remote sensing data are based on real-time acquisition and computing. Although the volume and the rate of data gathering may be manageable for a single data center, nation-wide or global data archives are storing massive data waiting for processing [10].
Table 1. Examples of different spatial, temporal, and spectral resolution of remote sensing systems 1.
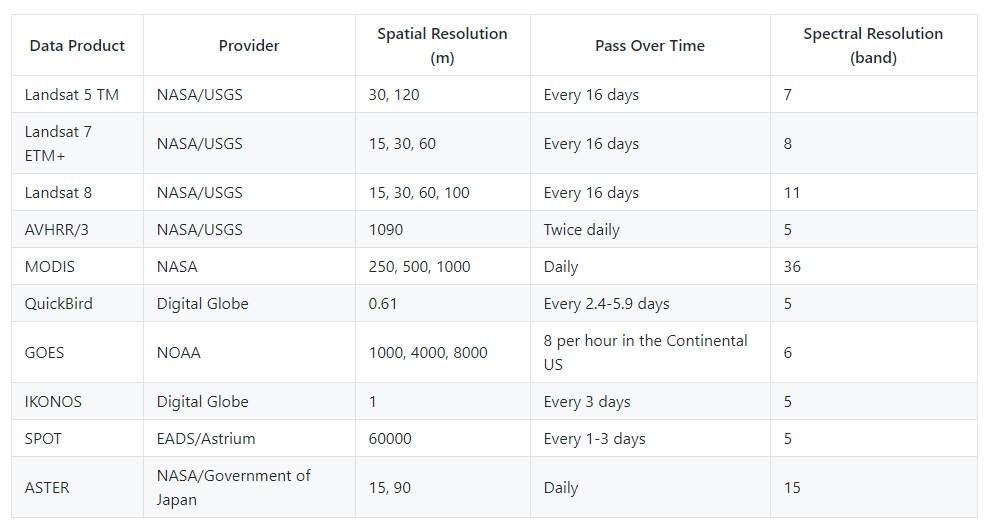
1 Derived from Wikipedia (https://en.wikipedia.org/wiki/Remote_sensing_satellite_and_data_overview)
3. REMOTE SENSING BIG DATA CHALLENGES
As an on-the-flow analysis, the remote sensing analysis can be divided into three stages: management, processing, and application (Figure 3). The management stage includes data acquisition, data storage, and data transmission. As mentioned above, remote sensing big data are always in huge volume combined with real-time acquisition and multi-scales, so identifying the most important and most closely-related data in the shortest time is of great significance for data owning. Efficient data storage and data delivery are crucial as well. In terms of data processing, these massive remote sensing data cause challenges in every sub-stage including image fusion, classification, radiometric correction, image enhancement, etc. When applying remote sensing data in the real world, challenges lie in visualization as well as practical collaboration between distributed data centers. The following paragraphs elaborate special challenges and their reasons in each data analyzing stage.
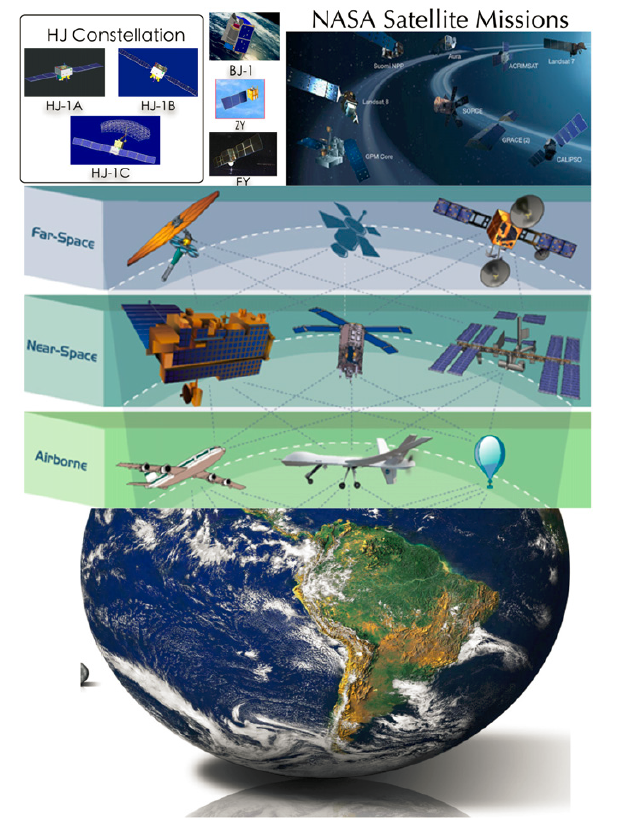
Figure 3. The satellite network for earth observation (Derived from [10]).
3.1. MANAGEMENT
Acquisition and Identification. Data acquisition is an important part based on which people can derive data values and address a real remote sensing problem. Challenges exist during acquisition because of heterogeneity of remote sensing data sets. Data gathered from airborne vehicles, satellites or other sensing devices should be preprocessed by geometric correction, atmospheric correction, terrain correction, geo-referencing, and noise removal, during which the data quality can be improved [14]. Furthermore, data will be meaningless unless they are utilized in real applications [15]. The main challenge of remote sensing big data, which is different from the traditional one is how to identify the valuable data, filter “no interest” data, and even combine data from different sources with different formats to solve real-world problems [12].
Storage. The increasingly advanced aircraft and satellites bring us information with high resolution, which enable us to monitor our living planet with multiple scales and real-time dynamics if we leverage the value of big data. At the same time, however, the variety and volume properties of geospatial big data challenge the physical and logical infrastructures of traditional data storage [16]. With the sharp growth of data sizes, the traditional structure related database will no longer satisfy the big data storage. What is more, the remote sensing data naturally are obtained by geographically distributed data centers all around the world (Figure 4) [10]. As a result, an optimal data storage for remote sensing big data requires the capability to effectively store, concurrently read and write, and reasonably organize the huge amount of data from different sources. Additionally, it should realize high scalability and be available to most people, even non-experts [8].
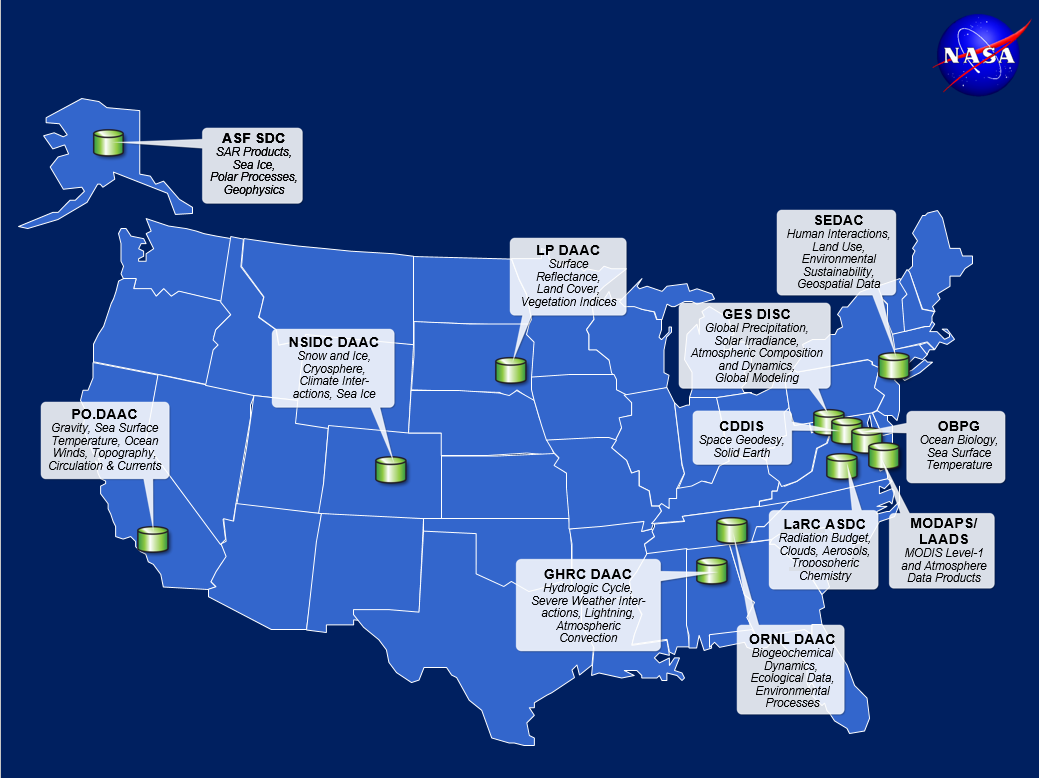
Figure 4. Discipline-oriented Data Centers: an example of geographically distributed data centers (Derived from http://ceos.org/document_management/Working_Groups/WGISS/Meetings/WGISS-40/20150929_Tuesday/09.29_10.45_NASA_Agency_Report.pptx).
Transmission. Although data centers are generally distributed geographically far away, they can connect to each other by the Internet. So the effective data transmission between data centers through the network is critically required. The communication and connection of data from different sources would cause the time-consuming problem due to network bandwidth limitations [10]. Remote sensing data transmission is needed not only between data centers but also from data centers to users. So-called “data delivery” offers users remote sensing data as well as metadata, both at ground data stations and those networks receiving data from ground stations. In a traditional way, a user download the data from a data archive in networks to their personal computers. It can be inapplicable in the big data context, because of its vast quantity and extremely high diversity. This poses a challenge to data transmission when a large amount of data need receiving and analyzing in a very short time [15].
3.2. PROCESSING
Computing. Real-time or near real-time satellite monitoring needs a constant data flow receiving, further processing, and analyzing data for end users. So, a data-intensive computing problem arises when facing the big data issue. The design of a high-performance big data computing system should realize the real-time or near real-time data analyses. To realize the demands of real-time processing, artificial intelligence processing methods are indispensable [8]. Meanwhile, as mentioned above, remote sensing data are housed by different data centers or data stations which are usually distributed geographically. The design of the big data computing system also should meet the requirement of integrating resources located in different places [17]. Another challenge for big data computing remains in energy consumption. For instance, in 2014, about 70 billion kwh of electricity was consumed by data centers in the US, which represents 2% of the total consumption of electricity in the whole country. What is more, energy consumption of data centers in the US grew by 24% over 2010-2014 [18].
Representation. The difficulties in remote sensing big data representation are in two main aspects. First of all, there is a “semantic gap” in data representation [19], i.e., similar signatures may represent different field objects while different signatures could denote the same field objects. The “semantic gap” results from changeable spectral signatures of field data due to environment influence, surface pollution, seasonal changes, as well as adjacency effect by nearby objects [20]. Second, remote sensing data comprised of various spectral and spatial resolutions, together with those unorganized individual pictures, are difficult to manipulate by traditional methods [15].
Fusion. Remote sensing data are characterized by multiple spatio-temporal scales, which means different rules and features at different scales. The spatial scales range from local, regional, national and global; the temporal scales include seconds, hours, years, decades, and even millennia [8]. To integrate these multi-scale data into one system or platform remains a tough task. In traditional methods, data fusion can be accomplished at the pixel level, feature level, and decision level [21]. In the context of big data, the traditional approaches are difficult to utilize effectively, so new technologies are required to tackle the fusion of remote sensing big data [15].
3.3. APPLICATION
Visualization. Visualization enables data users to have a deeper understanding of the big data they have. Although data visualization is the stage after data owning and analyzing, it should be considered as early as the other two. Given remote sensing big data in PB level, it is a big challenge to aggregate valuable data from diverse data sources, import them into decision-making models, and monitor their dynamic variations [15].
Collaboration. Generally speaking, remote sensing data are distributed geographically among different data centers, agents or industries, which can be an obstacle in data accessibility and connectivity [22]. Some data owners regard their big data as proprietary and are not willing to share data unless potential benefits of the data sharing outweigh the possible risks. The ineffective collaboration would pose challenges to data application and exploitation [15]. It is a big issue for government institutions as well. For instance, albeit NASA is now offering substantial remote sensing data to the public with its Open Government Plan [6], most high-quality images are still inaccessible for the public.
4. REMOTE SENSING BIG DATA OPPORTUNITIES
Challenges are always followed by opportunities. In fact, remote sensing big data technologies have been applied in many fields in both the social sciences and the natural sciences. In one case, remote sensing big data was used in an oil spill detection task, by the integration of MERIS data, MODIS data, and social media data with the help of crowd-sourcing and machine learning algorithms like SVM (support vector machine) and k-nearest neighbor classifier (Figure 5A) [15]. In the case of paddy growth stages detection, with the usage of multi-temporal analysis of remote sensing big data with heuristic algorithms, people could learn useful information about the needs of fertilizer, water, and period of planting to optimize crop productivity (Figure 5B) [23]. Scientists also presented a cloud computing technique with multi-layer hardware/software architecture for monitoring and controlling the behavior and security of wind turbines in Eolic parks [1]. In the field of natural science, the near-real-time or real-time data can be useful in various time-critical areas like wildfires (Figure 5C), floods, volcanoes, hurricanes, storms, etc. For instance, data from multiple NASA Earth observation satellites can be essential to understand the tropical cyclone dynamics, to explore the relationships between fires and environmental factors, and to establish connections between regulatory decisions, and land-use actions by analyzing the positions and distributions of land-cover changes (Figure 5D) [9].
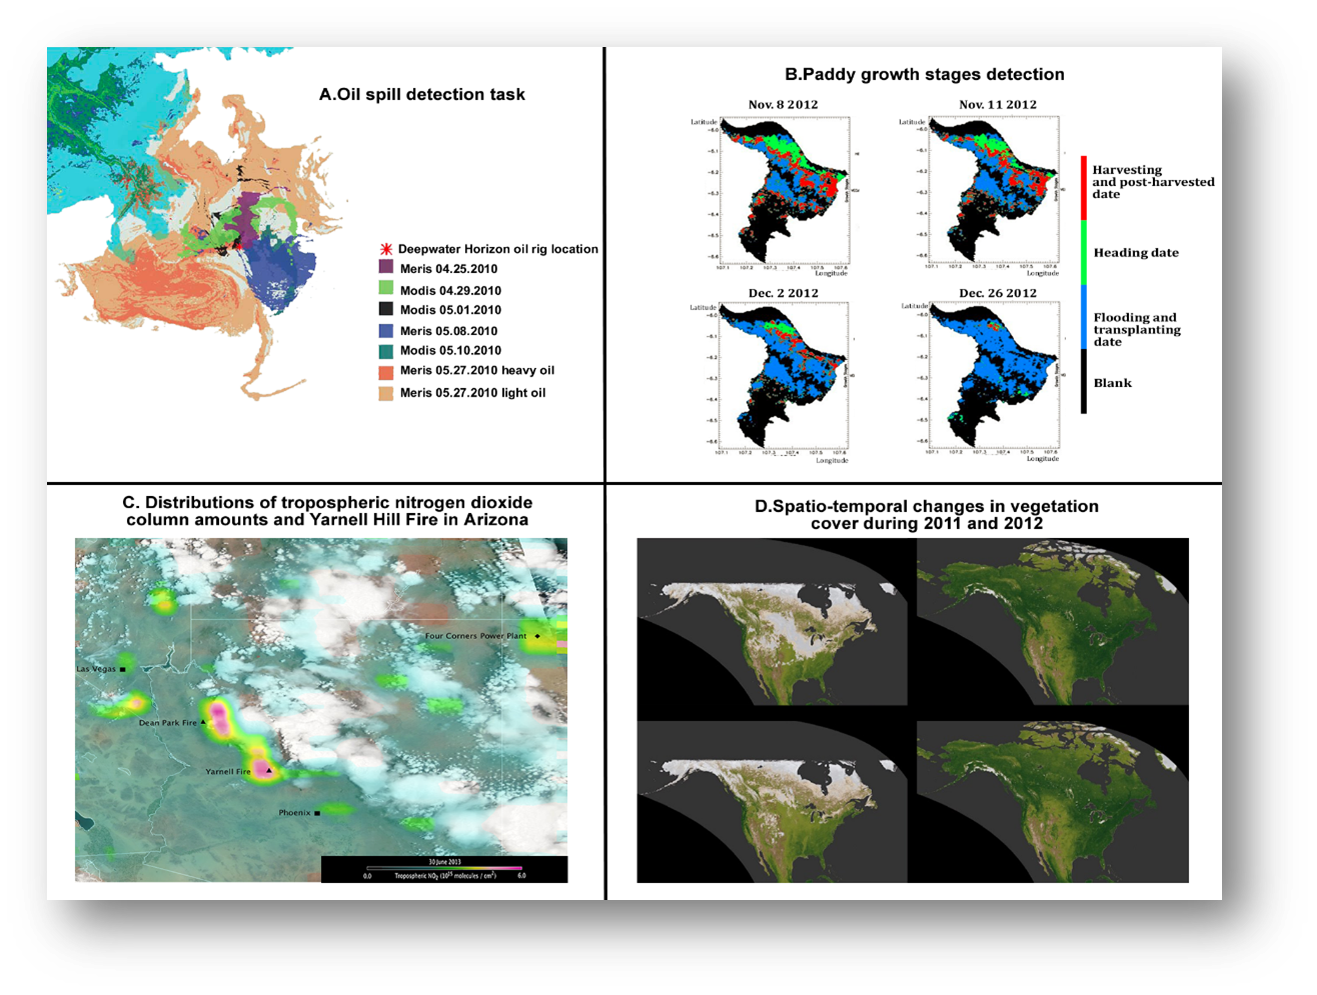
Figure 5. Examples of Remote Sensing big data applications in different fields.
A. Oil spill detection on multi-temporal and multisource space borne remote sensing images using big data in remote sensing. Derived from [15].
B. Paddy growth stages distribution map using MODIS and MERIS images. Derived from [23].
C. Enhanced tropospheric nitrogen dioxide column amounts associated with the Yarnell Hill Fire in Arizona. Derived from http://eijournal.com/print/articles/managing-big-data.
D. The top-left and bottom-left images portray dormancy over 2001-2012. The top-right and bottom-right images describe the growing season conditions over 2001-2012. The 2012 dormancy period is striking in terms of the decreased snow cover compared with the conditions in 2001.
Derived from http://eijournal.com/print/articles/managing-big-data.
5. STATE-OF-THE-ART TECHNOLOGIES AND METHODS: A CASE STUDY OF NASA
To solve the big data challenges and to take advantage of the opportunities, people have been making effort to develop new technologies to solve all kinds of big data issues. For example, because of the properties of big data, distributed storage technologies are needed to allocate resources and provide services to users with low cost and convenient operation. To meet the requirement of real-time or near-real-time processing, practical artificial intelligence analysis methods are indispensable as well [8]. To this end, newly developed computing platforms, algorithms as well as software systems have been developed, aiming at making big data in the remote sensing context manageable and useful.
As a robust big data technique, cloud computing infrastructure tackles the big data issues better than the traditional physical computers because of its flexible processors, memory, and size of disks [24]. Being virtualized technology, cloud computing is also more available and affordable. Another merit of cloud platform is the cloud storage, which helps collaborate and integrate data from different sources on a shared and scalable platform [8]. In terms of database, NoSQL is exploited in managing unstructured massive data in the remote sensing domain. Based on this, efficient data retrieval, as well as high throughput remote sensing data accessing, could be realized [10]. What is more, to meet the requirement of big data, geospatial data analysis has transferred from traditional data mining or machine learning to MapReduce/ Hadoop technology, which performs as a good parallel programming model due to its scalability and fault tolerance to address big data issues. Nonetheless, the use of MapReduce/Hadoop technology is sometimes limited in remote sensing big data application because of its high dimensionality [3].
The National Aeronautics and Space Administration (NASA) is in charge of aeronautics research, aerospace research, and civilian space programs [25]. In each second, NASA collects approximately 1.7GB of data from over 100 active missions, and the rate of collection is growing exponentially as well [6]. These data sets are of great importance for NASA, as they set the stage for the following scientific analysis and application. As a result, how to handle, store, and manage these massive data derived from their satellites is a huge challenge for NASA.
Apart from the growing volume of data, challenges for NASA also include data indexing, data transferring, increasing rates of development of state-of-the-art technologies and methods, and the decreasing budget environment [6]. When making effort to match data to user needs, the diversity and complexity properties of data pose the most significant challenge particularly for those non-expert users, because data sets from NASA span wide scientific disciplines with myriad parameters and often combined with different resolutions as well as geographic projections. On the other hand, the high-dimension and geographically distributed data also pose challenges even for those expert users, e.g., when they are exploring long-term analyses [9]. Developing new technologies and methods to make advantages of big data is always of vital interest to NASA. Below are some specific examples of NASA’s efforts on addressing big data issues.
NASA Center for Climate Simulation (NCCS). The NCCS is the only facility that is specifically designed for data storage and computational needs of climate and weather research in NASA. To realize the advanced, usable and efficient high-performance computing services, the NCCS provides supercomputing and state-of-the-art data services as well. Until the year 2015, the NCCS held 32PB of data [6]. The NCCS runs the SGI Data Migration Facility to manage long-term archived data with a number of SGI servers, through which users can access the data archive [26], [27]. The NCCS also provides access to advanced visualization tools through its Remote Visualization Systems and the Visualization Wall, with which people are able to render the image, display still and animated content, getting a better understanding of the data housed in the system [28], [29].
Atmospheric Science Data Center (ASDC). As part of NASA’s Earth Science enterprise and the U.S. Global Change Research Program, the ASDC is in charge of data archival, distribution, and processing in the field of earth science [6]. By supporting nearly 50 projects and about 1,700 data sets, the ASDC inspires a number of scientists, educators, decision makers, and also the public, specializing in atmospheric data to dig into the relationships between global climate change and human activities [30].
Mission Data Processing and Control System (MPCS). The MPCS is a part of NASA’s Advanced Multi-Mission Operations System (AMMOS) catalog. Developed with modern architecture and technology, the MPCS is successful in adding and subtracting features in the module and high configuration, displaying fixed paged in real-time and realizing automation, multi-mission, and multiphase [31]. The MPCS generates data visualizations and gives support to the flight operations team.
Pleiades Supercomputer. Pleiades Supercomputer is one of the most powerful supercomputers around the world. It represents NASA’s technology, and meets the super-computing requirements [32], [33]. It is not only applied in the challenging projects like space weather scenarios, but also used to generate cosmological simulation [6]. With its distributed-memory SGI ICE cluster connecting to InfiniBand (IB) with a dual-plane hypercube technology, the Pleiades Supercomputer enables NASA scientists to conduct missions by modeling or simulation.
NASA Earth Exchange (NEX). The NEX is a virtual laboratory that integrates super-computing, modeling, visualization, algorithms, with social network as well as the collaborative technologies. With the supercomputing facility at NASA, the NEX supports scientists who are working on long-term analysis or large regional areas [34]. For instance, in 2015, some researchers, who attempted to conduct a mosaic of 9,000 Landsat Thematic Mapper scenes which needed atmospheric correction, and to retrieve vegetation density with 30*30m cell size under the NEX environment, merely spent a few hours on the supercomputer to accomplish the whole processing of over 300 billion pixels [6].
Mars Science Laboratory (MSL). The MSL is a part of Mars Exploration Program of NASA [35]. In the program, cloud computing and cloud storage solutions were utilized to manage their big data. The MSL relied heavily on mission-critical applications which deliver over 150 GB per second to a global community. What the team did was to develop a solution, allowing people to download raw data of interest from Curiosity directly and to place them into the “Amazon S3 storage buckets”. With the MSL, data from the Curiosity rover can be stored, processed, and transferred through the cloud; after that, people could organize the data in scalable databases or expose them to applications through an effective interface [6].
6. CONCLUSIONS
Properties of remote sensing big data are concluded as “3H” in this paper: huge volume, high dimension, and high complexity. The huge volume underlines the vast amount of data and metadata, and the fast speed of data proliferation. All kinds of sensors on airborne and space-borne are main generators for remote sensing big data. The high dimension of remote sensing big data is caused by their different spatial, spectral, and temporal resolution. Applications in some areas, e.g., climate change, need the correlation of these high-dimensional big data because the observation ranges from region to globe. The high complexity lies in three aspects, i.e., metadata, data velocity, and format diversity. Different data sources trigger the diversity of data formats and metadata structures, and the property of velocity is based on the real-time acquisition and processing.
Big data will remain as “a lot of data” unless they are processed to generate great value for making decisions. Challenges arise when remote sensing big data are managed, analyzed, and applied to real-world problems. Due to their properties, it is always difficult to identify the most valuable ones from massive big data, to reasonably organize and store the huge amount of data, or to transmit them without network bandwidth limitation efficiently. When analyzing big data flows, challenges lie in data computing, data representation, and data fusion. An ideal big data computing system needs to meet demands of real-time processing and integrating geographically distributed resources, and take energy consumption into account. The characteristics of remote sensing data also cause challenges in representation and data fusion. In the context of big data, to bridge the “semantic gap” and to integrate multi-scale data into one system is rather difficult. In terms of data application, challenges exist in data visualization and collaboration between different data centers, which requires new methods to make remote sensing applications more practical and effective.
Big challenges bring big opportunities. Since the big data age has arrived, remote sensing big data technologies have been applied in many fields in the social sciences and the natural sciences. Meanwhile, scientists and researchers are making efforts to develop technologies and methods to meet the unique requirements for remote sensing big data. For instance, this paper outlines six big data activities and approaches pursued by NASA to explain how they are managing, storing, archiving, analyzing, visualizing and applying their big data. The efforts include NASA Center for Climate Simulation (NCCS), Atmospheric Science Data Center (ASDC), Mission Data Processing and Control System (MPCS), Pleiades Supercomputer, NASA Earth Exchange laboratory (NEX), and Mars Science Laboratory (MSL). In the future, when we are faced with new challenges and requirements, techniques will be bound to develop and improve. The effort in harnessing big data in all fields will never stop.
REFERENCES
- E. Moguel, J. C. Preciado, F. Sánchez-Figueroa, M. A. Preciado, and J. Hernández, “Multilayer Big Data Architecture for Remote Sensing in Eolic Parks,” IEEE J. Sel. Top. Appl. Earth Obs. Remote Sens., vol. 8, no. 10, pp. 4714–4719, 2015.
- M. Babaee, S. Tsoukalas, G. Rigoll, and M. Datcu, “Visualization-Based Active Learning for the Annotation of SAR Images,” IEEE J. Sel. Top. Appl. Earth Obs. Remote Sens., vol. 8, no. 10, pp. 4687–4698, 2015.
- J. L. Schnase et al., “MERRA Analytic Services: Meeting the Big Data challenges of climate science through cloud-enabled Climate Analytics-as-a-Service,” Comput. Environ. Urban Syst., vol. 61, pp. 198–211, 2014.
- C. L. Philip Chen and C. Y. Zhang, “Data-intensive applications, challenges, techniques and technologies: A survey on Big Data,” Inf. Sci. (Ny)., vol. 275, pp. 314–347, 2014.
- H. Guo, L. Wang, F. Chen, and D. Liang, “Scientific big data and Digital Earth,” Chinese Sci. Bull., vol. 59, no. 35, pp. 5066–5073, 2014.
- N. Skytland, “What is NASA doing with Big Data today?,” 2012. [Online]. Available: https://open.nasa.gov/blog/what-is-nasa-doing-with-big-data-today/. [Accessed: 14-Mar-2017].
- NASA, “Nimbus: NASA Remembers First Earth Observations,” 2014. [Online]. Available: https://www.nasa.gov/content/goddard/nimbus-nasa-remembers-first-earth-observations. [Accessed: 12-Mar-2017].
- H. Guo, Z. Liu, H. Jiang, C. Wang, J. Liu, and D. Liang, “Big Earth Data: a new challenge and opportunity for Digital Earth’s development,” Int. J. Digit. Earth, vol. 10, no. 1, pp. 1–12, 2017.
- H. Ramapriyan, J. Brennan, J. Walter, and J. Behnke, “NASA tackles complex data challenges,” 2013. [Online]. Available: http://eijournal.com/print/articles/managing-big-data. [Accessed: 10-Mar-2017].
- Y. Ma et al., “Remote sensing big data computing: Challenges and opportunities,” Futur. Gener. Comput. Syst., vol. 51, pp. 47–60, 2015.
- N. Cressie and C. Wikle, “Statistics for Spatio-Temporal Data,” Chance, vol. 27, no. 2, pp. 64–64, 2014.
- M. M. Rathore, A. Ahmad, A. Paul, and A. Daniel, “Hadoop based real-Time Big Data Architecture for remote sensing Earth Observatory System,” 6th Int. Conf. Comput. Commun. Netw. Technol. ICCCNT 2015, vol. i, 2016.
- P. Leland, “Big Data issues for Remote Sensing: Variety,” IEEE International Geoscience and Remote Sensing Symposium (IGARSS), pp. 2153 –7003, Mar. 2016.
- P. M. Mather and M. Koch, Computer Processing of Remotely-Sensed Images: An Introduction, 4th ed. New York, NY, USA: Wiley, 2011.
- M. Chi, A. Plaza, J. A. Benediktsson, Sun,Zhongyi, J. Shen, and Y. Zhu, “Big Data for Remote Sensing : Challenges and Opportunities,” Proc. IEEE, vol. 104, no. 11, p. 23, 2015.
- Demchenko, Yuri, Z. Zhao, P. Grosso, A. Wibisono, and C. de Laat, “Addressing Big Data Challenges for Scientific Data Infrastructure,” in IEEE 4th International Conference on Cloud Computing Technology and Science, 2012, pp. 614–617.
- A. Plaza, D. Valencia, and J. Plaza, “An experimental comparison of parallel algorithms for hyperspectral analysis using heterogeneous and homogeneous networks of workstations,” Parallel Comput., vol. 34, no. 2, pp. 92–114, 2008.
- Y. Sverdlik, “Here’s How Much Energy All US Data Centers Consume,” Data Center Knowledge, 2016. [Online]. Available: http://www.datacenterknowledge.com/archives/2016/06/27/heres-how-much-energy-all-us-data-centers-consume/. [Accessed: 12-Mar-2017].
- V. N. Gudivada and V. V. Raghavan, “Content based image retrieval systems,” Computer (Long. Beach. Calif)., vol. 28, no. 9, pp. 18–22, 1995.
- J. Bao and M. Chi, “Spectral Derivative Features for Classification of Hyperspectral Remote Sensing Images : Experimental,” IEEE J. Sel. Top. Appl. Earth Obs. Remote Sens., vol. 6, no. 2, pp. 594–601, 2013.
- E. Waltz and T. Waltz, “Principle and Practice of Image and Spacial Data Fusion,” in Handbook of Multisensor Data Fusion: Theory and Practice, M. E. Liggins, D. L. Hall, and J. Llinas, Eds. Dallas, Texas: CRC Press, 2009, pp. 257–278.
- M. A. Wulder and N. C. Coops, “Make Earth observations open access,” Nature, vol. 513, no. February, pp. 30–31, 2014.
- S. Mulyono and M. I. Fanany, “Remote sensing big data utilization for paddy growth stages detection,” 2015 IEEE International Conference on Aerospace Electronics and Remote Sensing Technology (ICARES), pp. 1–7, Mar. 2016.
- M. N. O. Sadiku, S. M. Musa, and O. D. Momoh, “Cloud computing: Opportunities and challenges,” IEEE potentials, vol. 33, no. 1, pp. 34–36, Jan. 2014.
- Wikipedia, “NASA,” 2017. [Online]. Available: https://en.wikipedia.org/wiki/NASA. [Accessed: 16-Mar-2017].
- NCCS, “Mission Statement,” 2017. [Online]. Available: https://www.nccs.nasa.gov/about_us. [Accessed: 11-Mar-2017].
- NCCS, “Mass Storage,” 2017. [Online]. Available: https://www.nccs.nasa.gov/services/mass_ storage. [Accessed: 16-Mar-2017].
- NCCS, “Remote Visualization,” 2017. [Online]. Available: https://www.nccs.nasa.gov/ services/remote_visualization. [Accessed: 12-Mar-2017].
- NCCS, “Visualization Wall,” 2017. [Online]. Available: https://www.nccs.nasa.gov /services/visualization_wall. [Accessed: 11-Mar-2017].
- ASDC, “Atmospheric Science Data Center,” 2017. [Online]. Available: https://eosweb.larc.nasa. gov/. [Accessed: 15-Mar-2017].
- J. Choi, L. Deforrest, and M. DeMore, “The MPCS Multimission Telemetry Processing and Display Ground System,” 2012. [Online]. Available: http://csse.usc.edu/GSAW/gsaw2012/s10/choi.pdf. [Accessed: 16-Mar-2017].
- B. Thigpen, “NASA’s Pleiades Supercomputer Ranks among World’s Most Powerful Systems,” 2015. [Online]. Available: https://www.nas.nasa.gov/publications/articles/feature_Pleiades_Thigpen.html. [Accessed: 15-Mar-2017].
- NAS, “Pleiades Supercomputer,” 2017. [Online]. Available: https://www.nas.nasa.gov/hecc /resources/pleiades.html. [Accessed: 12-Mar-2017].
- NEX, “NASA Earth Exchange,” 2011. [Online]. Available: https://nex.nasa.gov/nex/. [Accessed: 15-Mar-2017].
- MSL, “Mars Science Laboratory: Mission Science Goals,” NASA.gov, 2012. [Online]. Available: http://mars.jpl.nasa.gov/msl/mission/ science/goals/. [Accessed: 15-Mar-2017].